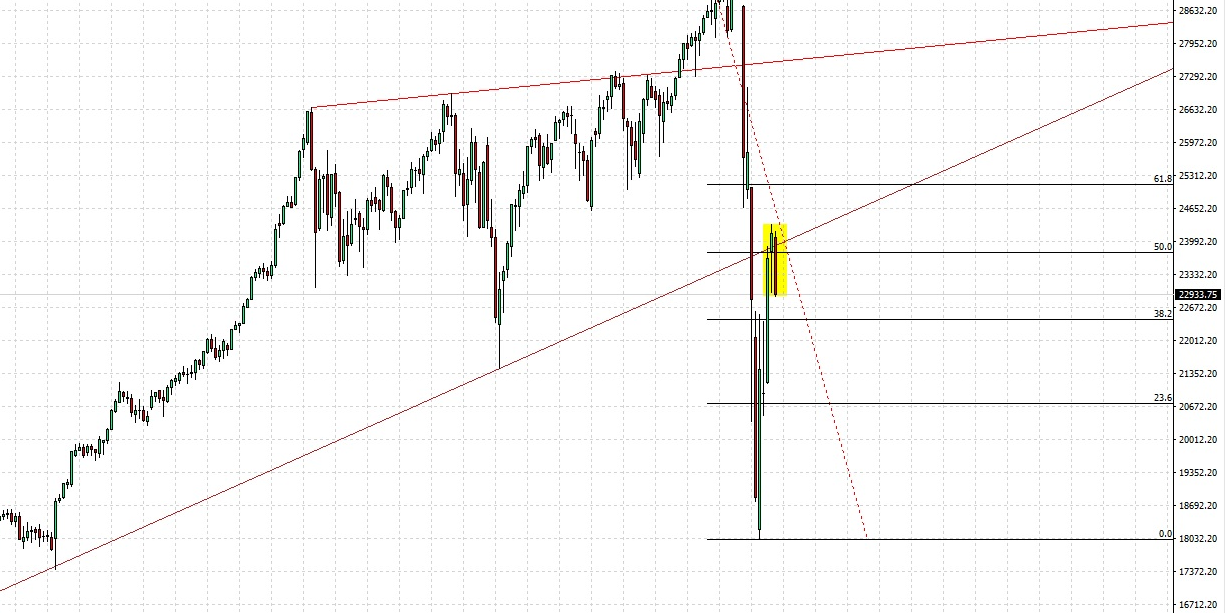
Looking at the Dow after pulling up a few key levels, it becomes clear that the market may be setting up for another leg down
- The supportive trend line was broken during the bearish rally when the market crash was in motion
- Since then a bottom had formed and the market retraced 50% of the entire bearish move (Fibonacci level)
- A hanging man formed at this level (hammer at resistance)
- The large bearish candle currently forming. In technical analysis this candle serves as “confirmation” of the anticipated move

Using price action and adding the relative strength index indicator to use in combination provides me with great insight into potential market movements. In technical analysis I only trade what I see, not what the news and talking heads have to say.
Please head over to the video gallery where I will be updating content on a regular basis. I look at sharing high value content so you don’t want to miss out!
Risk warning: Margin trading is risky and you may lose some or all of your capital. Any information on this website is published for educational purposes and should not be construed as financial advice. In short, you must take responsibility for your own trades and do due diligence to make informed decisions.


