
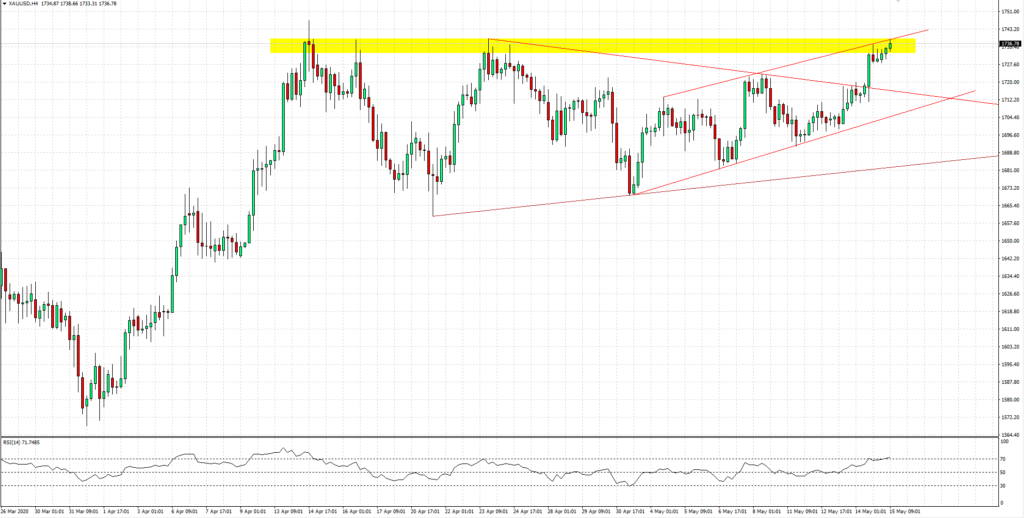
Gold has been trading within a triangular pattern and broke the resistance level yesterday where price has now met with the multi week high and resistance level of the up-channel.
It is now a bounce or break scenario. If the resistance level is broken and the bulls continue to dominate, it can take the market to the 1747 high made in mid April. The rsi is currently trading in the overbought area.
| Levels of interest | |
| Pivot | 1722 |
| R3 | 1762 |
| R2 | 1755 |
| R1 | 1748 |
| S1 | 1709 |
| S2 | 1702 |
Price action was used to analyze this chart.