
Trend lines are drawn to connect highs or lows. Using trend lines will not only help to determine the current trend, but also reveals the possibility of a change in trend. They will form support and resistance levels where traders look for trading opportunities or closing positions.
Drawing trend lines
See the chart below that shows a up trend as well as a down trend respectively. Each trend was determined by applying a trend line to the highs or lows. This will provide a clear indication of the current trend.
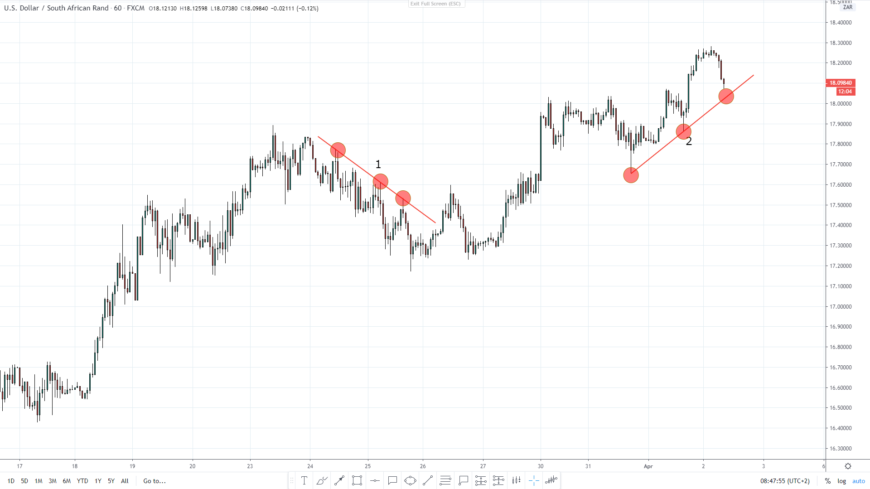
- Three swing highs can be noted in the down trend
- Two swing lows formed in an up trend and a third one can be seen emerging here
When these levels are drawn in a down trend they will be applied to the highs. In an up trend these levels will be applied to the lows. It’s the highs in a down trend and the lows in an up trend that help to draw trend lines. At least two swing highs or swing lows will be needed in order to draw a trend line effectively.
It is important to note that the more times a trend line is touched the more it will be used by traders as a support or resistance level. This does not mean that these levels will not break. It gives them more credibility and will be used by more traders.
Using wicks versus using bodies
Some traders may prefer to use the wicks of the candlesticks to draw trend lines while others may prefer using the bodies. Most traders will in fact use wicks although using the bodies is not uncommon. Both are an acceptable way of drawing trend lines.
See the example below of using wicks to draw.
Now let’s take a look at the same chart but this time using the candle bodies.

Trend lines are subjective so you should use it in a way that works for you.
Trading with trend lines
There are two main methods in terms of using trend lines to trade:
- Entering when price finds support or resistance at the trend line (swing trading)
- Entering when price breaks through the level (breakout trading)
Trend lines as support and resistance
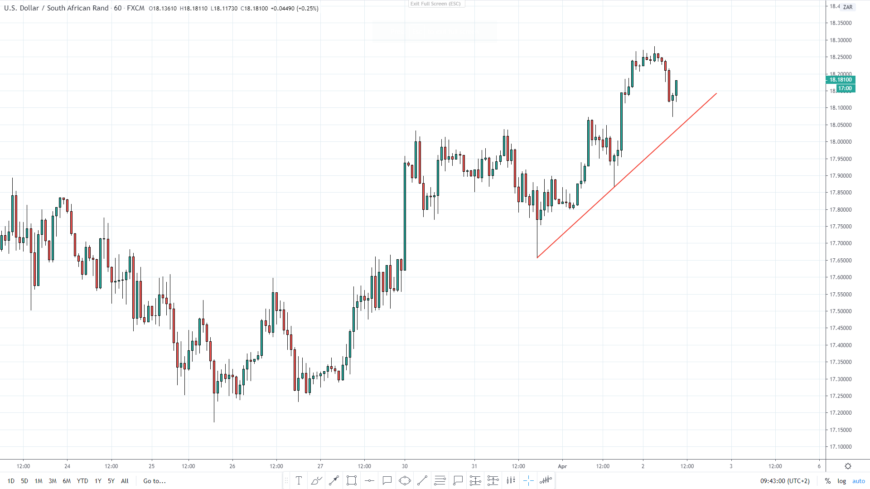
Once a trend line has been applied and it is functioning well as support or resistance, then it can be used to enter into the market once price comes back to it.
The chart above illustrates where price found support at the trend line. Notice how price moved higher from that area. Find support to take a buy order and position the stop loss below the trend line. For the stop loss it would be ideal to consider the most recent lows made by the market in combination with the supportive trend line.
When the trend line breaks
Trading the breakout is a method that is used when the actual level is broken by price, signalling an entry. When price breaks through a trend line it is no longer considered to be valid and price is likely to continue in the breakout direction. Bear in mind that a break has to have some level of conviction behind it, exceeding some “noise”.
Two methods can be used to enter a trend line break.
Aggressive entries
An aggressive entry is when a trade is opened once a breakout candle has been confirmed. A confirmed breakout candle is a candle that closes on the opposite side of the trend line after it was broken. Only then is the breakout valid.
Here are the key points around this trend line break trade:
- Price breaks through the capped trend line to the up side
- Wait for price to return and touch the trend line again, but from the other side where price finds support
- Once confirmed that the breakout is valid, enter into a long position
- Stop loss placed below the trend line keeping recent swing lows in mind
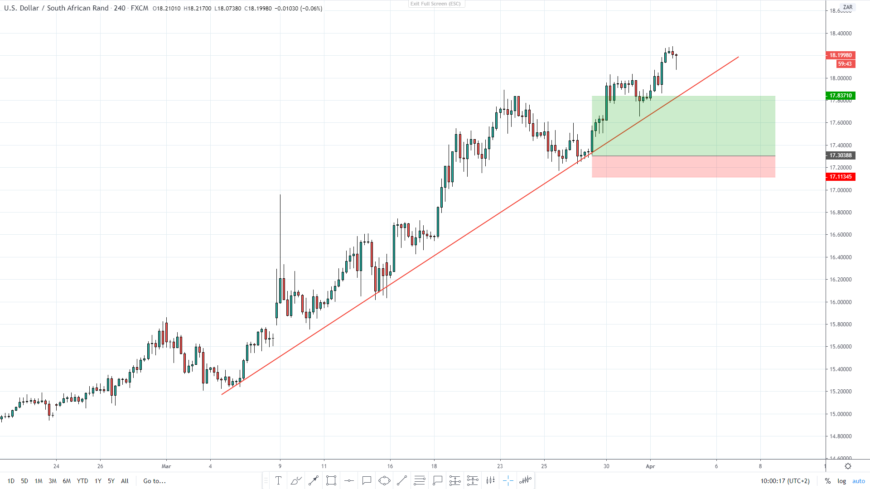
The above chart shows how a capped trend line serving as resistance was broken. this trend line served as a resistance level. After the breakout price retraced and tested the resistance as support. A bullish candlestick finally confirms that the breakout is likely to continue. Once the resistive trend line is tested as support, you can enter a long position. Place your stop loss below the recent lows below the trend line.
Caution trading the breakout of trend lines
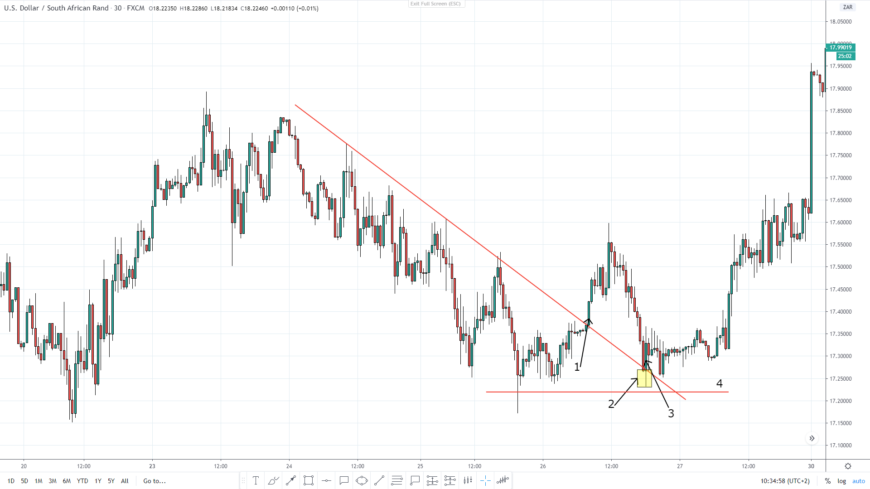
To trade the breakout of a trend line effectively it is not negotiable to wait for a candlestick to close on the opposite side of the trend line. The alternate principal can be when the other side of the trend line is tested as either support or resistance. If a candle has not closed on the other side of the trend line then it will not be considered as a breakout.
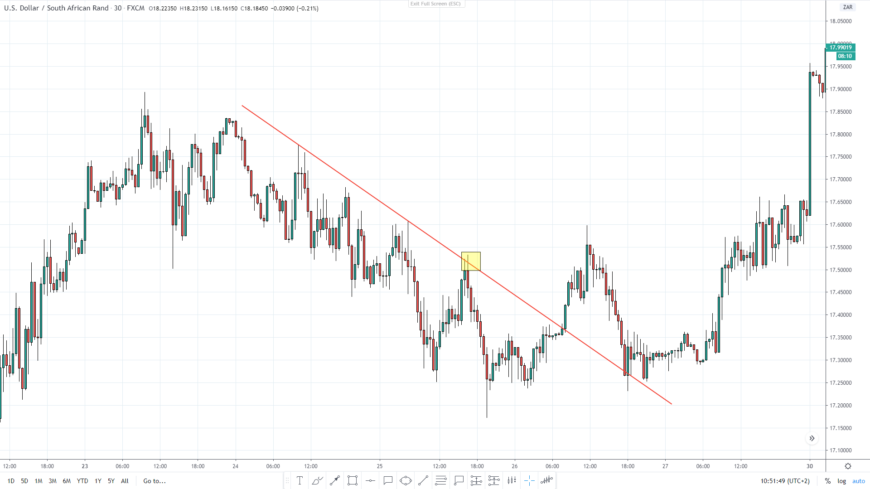
The chart above shows in the yellow box where price moved above the trend line but retraced again and closed below. If a trader went long once price broke this level it would have been an unsuccessful trade.
Summary
- Trend lines are drawn at an angel
- Trend lines are used to determine a trend and help make trading decisions
- Connect the lows to draw a trend line in an up trend
- Connect the highs to draw a trend line in a down trend
- A minimum of two lows would be needed to establish a trend line
- The more times a trend line is tested (touched), the more valid it is considered to be
- Trend lines are used as support and resistance levels. This method helps to identify where to enter trades
- Trend line breaks is when price breaks through a level. This is used as a technique to find breakout trade setups
Understanding support and resistance properly will enhance your use of trend lines. Try to avoid the smaller time frames because there is more noise on the lower time frames. H1, H4 and D1 and perfect periods to work on.