
Every move that the market makes takes place from a level that is based on support and resistance. It can be found in almost every pattern or trade setup.
The concept of support and resistance based on the tendency for price to stop and reverse at these levels which are predetermined by historic price movement (highs and lows).
Support and resistance
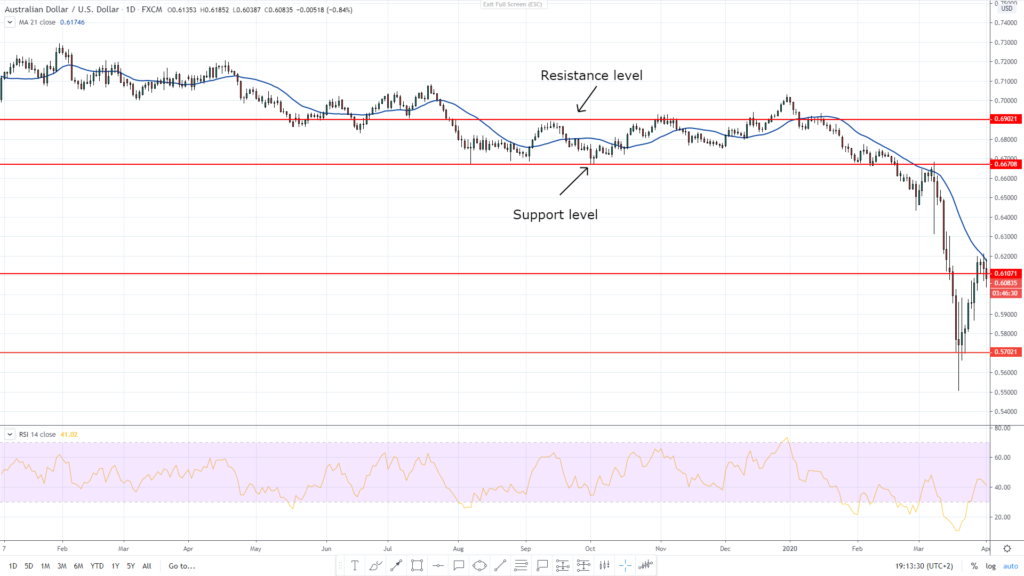
A resistance level is an area that the market tends to “respect” instead of breaking it. Resistance is found when price is rising and finds difficulty at a certain area it is unable to break higher. This resistance level is denoted by more than one test (touch) to the area.
A support level is an area that the market tends to respect instead of breaking. This time it is found as price is falling and reaches an area that it is not able to break through. In simplified terms, resistance would be the “ceiling” and support the “floor”. It is important to note that support and resistance levels are not necessarily a specific level but rather an area. This area will be defined as the area of value. This area gives you a certain space from which you can trade instead of a specific level or nothing.
Proactive and reactive support and resistance
Support and resistance areas are usually predictive as they highlight areas where price has not been but is likely to reach. These levels are based on historic price action and used in order to “predict” future levels. Proactive support and resistance levels include but are not limited to:
- Moving averages
- Fibonacci
- Pivots
- Trend lines
- Measured moves
Reactive support and resistance levels are the opposite. They are formed as a direct result of price action. This will include but is not limited to:
- Open high close low
- Certain candle patterns (Engulfing bar, tweezers etc)
- Open gaps
- Swing highs and swing lows
How do you identify support and resistance levels?
These levels can be identified during technical analysis with tools like trend lines. Many traders enjoy using pivot points. The good news is that there are now indicators to help with that. Previously these levels would have to be manually calculated. Technology evolved to produce indicators that instantly provide pivot levels on any time frame.
Should a resistance level be broken not exceeding some “noise”, it is likely to become support at some point in the future. The same would apply vice versa at a support level.
Something important to note about psychological support and resistance levels is that they will always have round numbers. For example 1500.00 is a psychological level where 1437 is more random. As price reaches levels with rounded numbers, traders perceive these levels as areas of value. These levels are likely to experience interruption in movement. A reversal could take place or price could hang around as the bears and bulls fight it out for control. The other possibility is that price simply breaks through this level. It’s best to always exercise caution when approaching these kind of levels if they were significant in the past as support or resistance.
How to use support and resistance levels
See the below example where support switched roles with resistance.
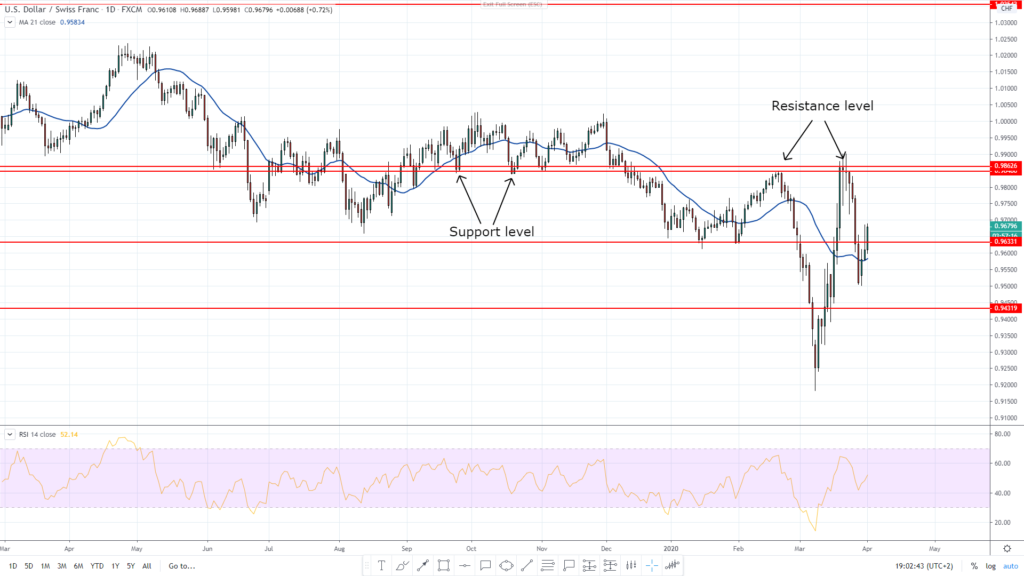
It’s a basic investment strategy that is commonly used by traders. When price moves between support and resistance levels, traders buy low (at support) and sell high (at resistance). This way you pick the highs and lows of the market movements. This can be done over and over to produce winning trades.
When working on determining investment timing to enter and exit trades, it is important to work on an interval period that suits your daily schedule. For example, short term traders will use charts like the one minute and five minute time frames. This means the price of the security is plotted every one or five minutes respectively. If you have a busy day it would be more beneficial for you to trade on the four hourly time frame or higher.
Although shorter time frame charts are used to make a final decision, longer term traders will typically trade on the hourly, four hourly, daily and weekly time frame. Some perhaps use the monthly as well.
When you analyze the charts you will soon enough realize that support and resistance forms the framework of your analysis. Mastering support and resistance principals will give you a strong advantage in the market.