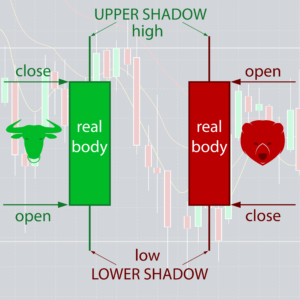
Japanese candlesticks display the high, low, opening and closing prices of a security for a specific period. The period is the time frame. So if a chart is on the 4 hour period, you would be able to see the open, highs, lows and close price for each 4 hour period. We refer to the fat part of the Japanese candlestick as the real body. This is what investors use to see if the closing price was higher or lower than the open price. The green candles show that price closed higher while the red candles show that price closed lower.
You can see the high and low for the period by using the shadows of the Japanese candlesticks. These shadows are the “wicks”. The wicks will also show you the price movement that took place during the period and you will have a clear view of the highs and lows in relation to the open and closing prices. The Japanese candlestick forms as the market moves so it will take shape accordingly.
Interpretation
Investors use Japanese candlesticks to “read” the price movement of securities. We use this information to understand the underlying investor sentiment. Analyzing Japanese candlestick charts is a technique developed in the 1700’s in Japan and was developed to track the prices of rice. Today we use this technique to trade any liquid financial asset like currencies, stocks and commodities.
Big green candlesticks will indicate that there is a lot of buying pressure in the market. Investors interpret this as an indication that price is bullish however market structure should be used to determine the sentiment instead of individual candlesticks. A simple example would be to consider using a bearish candlestick as a reversal signal at a major resistance level. Large red candlesticks will indicate strong selling pressure in the market as sellers are willing to enter the market. This will suggest that the price is bearish. The small details about candlesticks are used in order to interpret what is happening in the market and trade accordingly.
A very common reversal candlestick for example is the “hammer”. A hammer forms when the market rallies down strongly after the open price, later rising back u and closing near the high. Traders use hammers around support and resistance levels as “signals” for investors to enter the market. Traders use this technique to pick the highs and lows of the market.
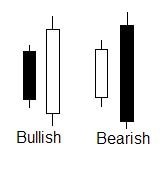
Bullish candlesticks
Signals up-trend movement. These forex candlesticks occur in different lengths. The longer the body the more significant the price increase.
Bearish candlesticks
A bearish candlestick signals down-trend movement. These forex candlesticks occur in different lengths. The longer the body the more significant the price decrease.
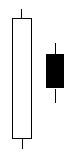
Long lower shadow
These forex candlesticks are used as bullish signals. The lower shadow/wick has to be at least 2x that of the real body size. The longer the wick, the better the signal.
Long upper shadow
Long upper shadow forex candlesticks are used as bearish signals. The shadow/wick has to be at least 2x that of the real body size. The longer the wick, the better the signal (more reliable).
Hammer
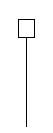
This is a bullish signal that occurs during a down-trend. The wick should be at least double the length of the real body. Hammers usually have little or no upper wick. When a hammer forms in a bullish trend it is known as a “hanging man”. This is a bearish signal for investors. Taking the long wick into account, this candlestick would need bearish confirmation by means of a candle closing below the low of the real body.
Shooting star
Harami
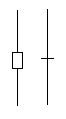
Doji
Dragonfly doji
Gravestone doji
The long legged doji
Engulfing bars
Spinning tops

Using these candlesticks in combination with support and resistance levels give you the basic structure to work with. Using them together helps to get deeper insight into the market movement but these are not the only factors to take into account because you will also need to apply good trader psychology and have a good understanding of market structure.
The complete price action course covers price action trading comprehensively. Candlesticks is just one part of the entire system. Understand the mechanics of the market through price action trading and leverage that to make profits. Please click on the bull below to visit the course page.